Delaunay三角剖分 
Delaunay三角剖分
此示例演示了如何计算输入图的 Delaunay 三角剖分。 我们首先使用随机 numpy 数组在 2D 网格上生成一组点,并生成一个包含这些顶点坐标且没有边的图。
import numpy as np
from scipy.spatial import Delaunay
import igraph as ig
import matplotlib.pyplot as plt

# Generate a random graph in the 2D unit cube
np.random.seed(0)  # To ensure reproducibility
x, y = np.random.rand(2, 30)
g = ig.Graph(30)
g.vs['x'] = x
g.vs['y'] = y
然后,我们使用 SciPy 的 Delaunay 函数 生成三角形,然后循环遍历它们并将它们添加回原始图。 我们确保之后简化图以删除三角形共享边导致的多重边。
# Calculate the delaunay triangulation, and add the edges into the original graph
coords = g.layout_auto().coords
delaunay = Delaunay(coords)
for tri in delaunay.simplices:
    g.add_edges([
        (tri[0], tri[1]),
        (tri[1], tri[2]),
        (tri[0], tri[2]),
    ])
g.simplify()
最后,我们显示该图
# Plot the graph
fig, ax = plt.subplots()
ig.plot(
    g,
    target=ax,
    vertex_size=0.04,
    vertex_color="lightblue",
    edge_width=0.8
)
plt.show()
我们的输出看起来像这样
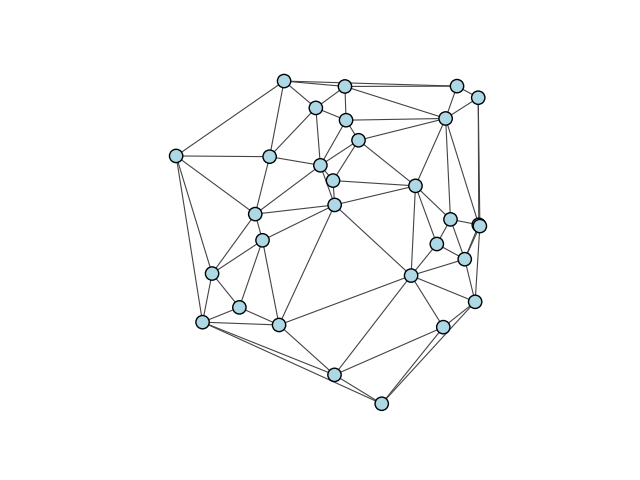
Delaunay三角剖分
高级:改进绘图样式
有时,我们想强调由 Delaunay 三角剖分生成的实际三角形。 我们将添加一些三角形,并根据它们的 y 坐标对其进行着色。
# Plot the triangles
fig, ax = plt.subplots()

palette = ig.GradientPalette("midnightblue", "lightblue", 100)
for tri in delaunay.simplices:
    # get the points of the triangle
    tri_points = [delaunay.points[tri[i]] for i in range(3)]

    # calculate the vertical center of the triangle
    center = (tri_points[0][1] + tri_points[1][1] + tri_points[2][1]) / 3

    # draw triangle onto axes
    poly = plt.Polygon(tri_points, color=palette.get(int(center*100)))
    ax.add_patch(poly)
然后,我们在顶部绘制原始图的边
# Plot the graph on top
ig.plot(
    g,
    target=ax,
    vertex_size=0.0,
    edge_width=0.2,
    edge_color="white",
)
plt.show()
最终输出看起来像这样

带有彩色三角形的Delaunay三角剖分。