社群 
社群
此示例展示了如何可视化图的社群或集群。 首先,创建图:为简单起见,我们这里只使用一个著名的图。
import igraph as ig
import matplotlib.pyplot as plt

g = ig.Graph.Famous("Zachary")
其次,定义集群。
# Use edge betweenness to detect communities
communities = g.community_edge_betweenness()
# ... and convert into a VertexClustering for plotting
communities = communities.as_clustering()
第三,为各个社群准备颜色
# Color each vertex and edge based on its community membership
num_communities = len(communities)
palette = ig.RainbowPalette(n=num_communities)
for i, community in enumerate(communities):
    g.vs[community]["color"] = i
    community_edges = g.es.select(_within=community)
    community_edges["color"] = i
最后,绘制图
# Plot with only vertex and edge coloring
fig, ax = plt.subplots()
ig.plot(
    communities,
    palette=palette,
    edge_width=1,
    target=ax,
    vertex_size=0.3,
)
… 并通过 代理艺术家 添加一个漂亮的图例
legend_handles = []
for i in range(num_communities):
    handle = ax.scatter(
        [], [],
        s=100,
        facecolor=palette.get(i),
        edgecolor="k",
        label=i,
    )
    legend_handles.append(handle)

ax.legend(
    handles=legend_handles,
    title='Community:',
    bbox_to_anchor=(0, 1.0),
    bbox_transform=ax.transAxes,
)
结果图如下所示。
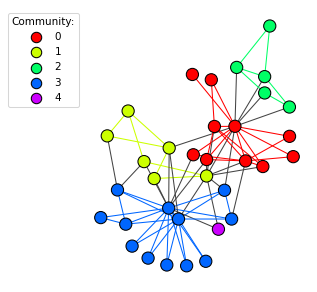
图及其社群通过颜色突出显示。
有关如何从顶点集群生成集群图的示例,请查看 生成集群图。