快速入门 
快速入门
对于那些渴望学习的人来说,本介绍将为您快速概述以下操作
构建图
设置节点和边的属性
使用 matplotlib 绘制图
将绘图保存为图像
将图导出和导入为
.gml文件
要了解 igraph 提供的更多功能,请查看图库!
import igraph as ig
import matplotlib.pyplot as plt

# Construct a graph with 3 vertices
n_vertices = 3
edges = [(0, 1), (0, 2), (0, 3), (0, 4), (1, 2), (1, 3), (1, 4), (3, 4)]
g = ig.Graph(n_vertices, edges)

# Set attributes for the graph, nodes, and edges
g["title"] = "Small Social Network"
g.vs["name"] = ["Daniel Morillas", "Kathy Archer", "Kyle Ding", "Joshua Walton", "Jana Hoyer"]
g.vs["gender"] = ["M", "F", "F", "M", "F"]
g.es["married"] = [False, False, False, False, False, False, False, True]

# Set individual attributes
g.vs[1]["name"] = "Kathy Morillas"
g.es[0]["married"] = True

# Plot in matplotlib
# Note that attributes can be set globally (e.g. vertex_size), or set individually using arrays (e.g. vertex_color)
fig, ax = plt.subplots(figsize=(5,5))
ig.plot(
    g,
    target=ax,
    layout="circle", # print nodes in a circular layout
    vertex_size=0.1,
    vertex_color=["steelblue" if gender == "M" else "salmon" for gender in g.vs["gender"]],
    vertex_frame_width=4.0,
    vertex_frame_color="white",
    vertex_label=g.vs["name"],
    vertex_label_size=7.0,
    edge_width=[2 if married else 1 for married in g.es["married"]],
    edge_color=["#7142cf" if married else "#AAA" for married in g.es["married"]]
)

plt.show()

# Save the graph as an image file
fig.savefig('social_network.png')
fig.savefig('social_network.jpg')
fig.savefig('social_network.pdf')

# Export and import a graph as a GML file.
g.save("social_network.gml")
g = ig.load("social_network.gml")
代码的输出如下图所示
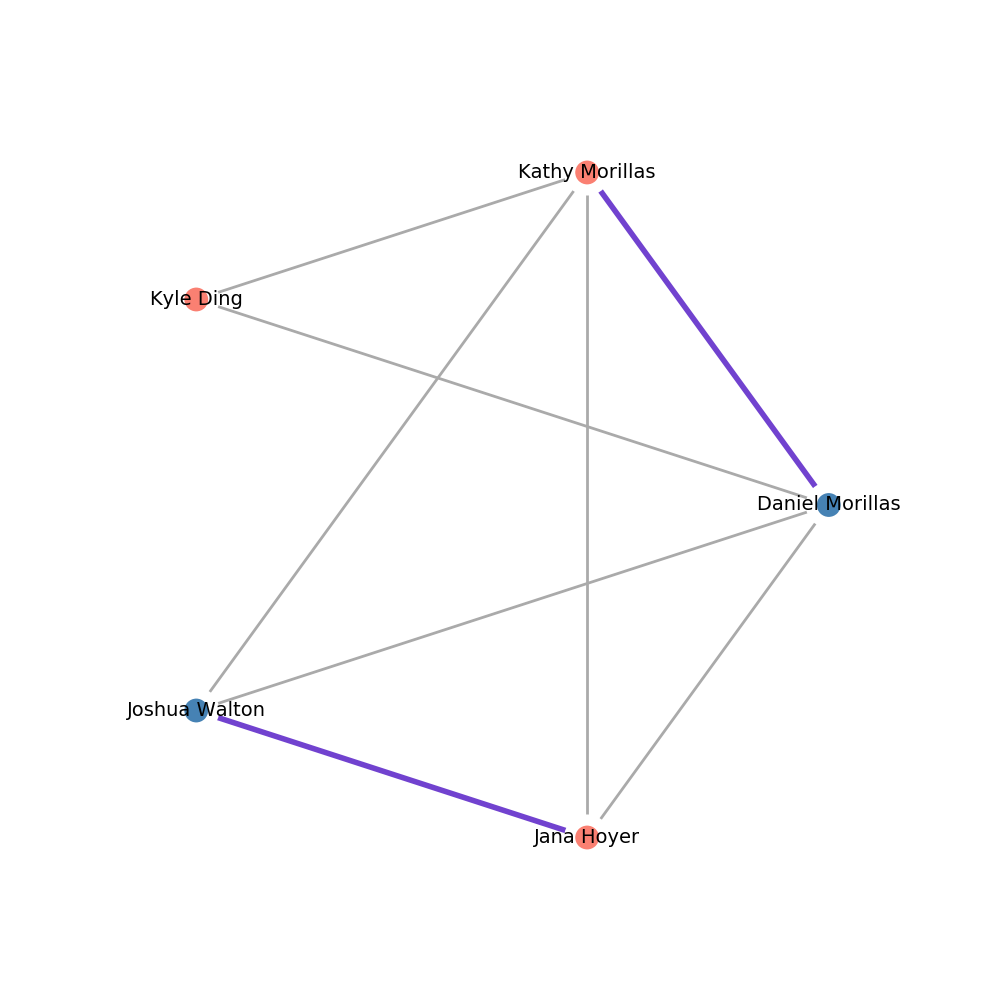
输出图