最短路径 
最短路径
此示例演示如何找到加权和无权图中两个顶点之间的最短距离。
要查找两个节点之间的最短路径或距离,我们可以使用 get_shortest_paths()。如果我们只对计算无权距离感兴趣,那么我们可以这样做
import igraph as ig
import matplotlib.pyplot as plt

# Find the shortest path on an unweighted graph
g = ig.Graph(
    6,
    [(0, 1), (0, 2), (1, 3), (2, 3), (2, 4), (3, 5), (4, 5)]
)

# g.get_shortest_paths() returns a list of vertex ID paths
results = g.get_shortest_paths(1, to=4, output="vpath")  # results = [[1, 0, 2, 4]]

if len(results[0]) > 0:
    # The distance is the number of vertices in the shortest path minus one.
    print("Shortest distance is: ", len(results[0])-1)
else:
    print("End node could not be reached!")
如果边有权重,我们将它们作为参数传入。请注意,我们将输出格式指定为 "epath",以便接收作为边列表的路径。这用于计算路径的长度。
# Find the shortest path on a weighted graph
g.es["weight"] = [2, 1, 5, 4, 7, 3, 2]

# g.get_shortest_paths() returns a list of edge ID paths
results = g.get_shortest_paths(
    0,
    to=5,
    weights=g.es["weight"],
    output="epath",
)
# results = [[1, 3, 5]]

if len(results[0]) > 0:
    # Add up the weights across all edges on the shortest path
    distance = 0
    for e in results[0]:
        distance += g.es[e]["weight"]
    print("Shortest weighted distance is: ", distance)
else:
    print("End node could not be reached!")
这两个最短路径的输出是
Shortest distance is:  3
Shortest weighted distance is:  8
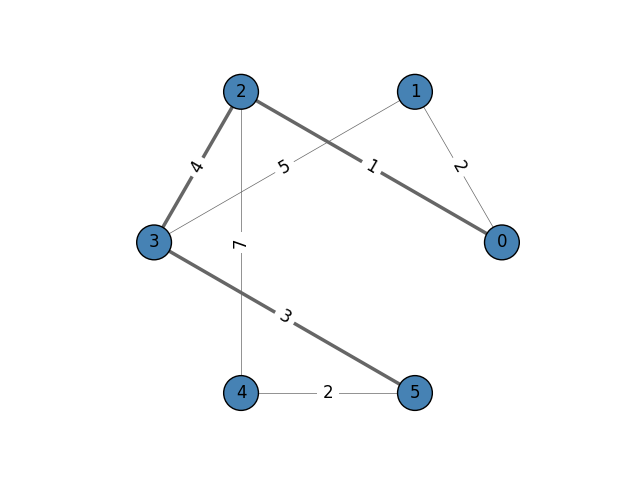
图 g,其中突出显示了从顶点 0 到顶点 5 的最短路径。
注意
get_shortest_paths()返回一个列表的列表,因为 to 参数也可以接受顶点 ID 的列表。在这种情况下,将找到到每个顶点的最短路径并存储在结果数组中。如果您有兴趣查找所有最短路径,请查看
get_all_shortest_paths()。
如果您想知道可视化图形是如何完成的,这是代码
import igraph as ig
import matplotlib.pyplot as plt

# Construct the graph
g = ig.Graph(
    6,
    [(0, 1), (0, 2), (1, 3), (2, 3), (2, 4), (3, 5), (4, 5)]
)
g.es["weight"] = [2, 1, 5, 4, 7, 3, 2]

# Get a shortest path along edges
results = g.get_shortest_paths(
    0,
    to=5,
    weights=g.es["weight"],
    output="epath",
)
# results = [[1, 3, 5]]

# Plot graph
g.es['width'] = 0.5
g.es[results[0]]['width'] = 2.5

fig, ax = plt.subplots()
ig.plot(
    g,
    target=ax,
    layout='circle',
    vertex_color='steelblue',
    vertex_label=range(g.vcount()),
    edge_width=g.es['width'],
    edge_label=g.es["weight"],
    edge_color='#666',
    edge_align_label=True,
    edge_background='white'
)