通过最大流计算最大二分匹配 
通过最大流计算最大二分匹配
此示例演示如何使用最大流可视化二分匹配(参见 maxflow())。
注意
maximum_bipartite_matching() 通常是找到最大二分匹配的更好方法。有关如何使用该方法的演示,请查看 最大二分匹配。
import igraph as ig
import matplotlib.pyplot as plt

# Generate the graph
g = ig.Graph(
    9,
    [(0, 4), (0, 5), (1, 4), (1, 6), (1, 7), (2, 5), (2, 7), (2, 8), (3, 6), (3, 7)],
    directed=True
)

# Assign nodes 0-3 to one side, and the nodes 4-8 to the other side
g.vs[range(4)]["type"] = True
g.vs[range(4, 9)]["type"] = False

g.add_vertices(2)
g.add_edges([(9, 0), (9, 1), (9, 2), (9, 3)]) # connect source to one side
g.add_edges([(4, 10), (5, 10), (6, 10), (7, 10), (8, 10)]) # ... and sinks to the other

flow = g.maxflow(9, 10) # not setting capacities means that all edges have capacity 1.0
print("Size of maximum matching (maxflow) is:", flow.value)
让我们将输出与 maximum_bipartite_matching() 进行比较
# Compare this to the "maximum_bipartite_matching()" function
g2 = g.copy()
g2.delete_vertices([9, 10]) # delete the source and sink, which are unneeded

matching = g2.maximum_bipartite_matching()

matching_size = sum(1 for i in range(4) if matching.is_matched(i))
print("Size of maximum matching (maximum_bipartite_matching) is:", matching_size)
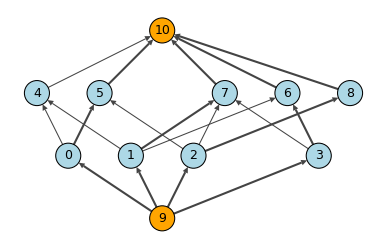
最后,通过添加匹配项,很好地显示原始流图
# Manually set the position of source and sink to display nicely
layout = g.layout_bipartite()
layout[9] = (2, -1)
layout[10] = (2, 2)

fig, ax = plt.subplots()
ig.plot(
    g,
    target=ax,
    layout=layout,
    vertex_size=0.4,
    vertex_label=range(g.vcount()),
    vertex_color=["lightblue" if i < 9 else "orange" for i in range(11)],
    edge_width=[1.0 + flow.flow[i] for i in range(g.ecount())]
)
plt.show()
收到的输出是
Size of maximum matching (maxflow) is: 4.0
Size of maximum matching (maximum_bipartite_matching) is: 4
最大二分匹配
注意
最大流将容量表示为实数值,这就是为什么我们的结果是 4.0 而不是 4。