桥 
桥
此示例展示了如何使用 bridges_method() 计算和可视化图中的桥。 有关割点的示例,请参见割点。
import igraph as ig
import matplotlib.pyplot as plt

# Construct graph
g = ig.Graph(14, [(0, 1), (1, 2), (2, 3), (0, 3), (0, 2), (1, 3), (3, 4),
        (4, 5), (5, 6), (6, 4), (6, 7), (7, 8), (7, 9), (9, 10), (10 ,11),
        (11 ,7), (7, 10), (8, 9), (8, 10), (5, 12), (12, 13)])

# Find and color bridges
bridges = g.bridges()
g.es["color"] = "gray"
g.es[bridges]["color"] = "red"
g.es["width"] = 0.8
g.es[bridges]["width"] = 1.2

# Plot graph
fig, ax = plt.subplots()
ig.plot(
    g,
    target=ax,
    vertex_size=0.3,
    vertex_color="lightblue",
    vertex_label=range(g.vcount())
)
plt.show()
该图看起来像这样
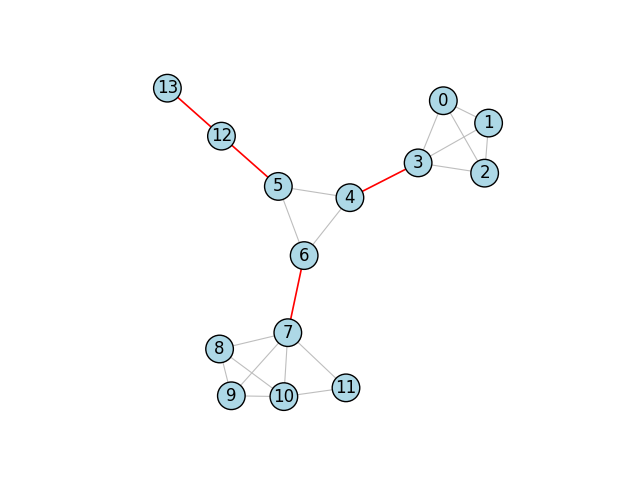
桥边用红色标记。
高级:切割效果
桥是当被移除时,会将图分割成比开始时更多个组件的边。 为了强调从图中移除边的效果,我们可以通过使用边标签为每个桥添加一个小的“x”效果。 我们添加以下代码来仅为桥定义边标签
g.es["label"] = ""
g.es[bridges]["label"] = "x"
然后当我们绘制时...
# Plot graph
fig, ax = plt.subplots()
ig.plot(
    g,
    target=ax,
    vertex_size=0.3,
    vertex_color="lightblue",
    vertex_label=range(g.vcount()),
    edge_background="#FFF0",    # transparent background color
    edge_align_label=True,      # make sure labels are aligned with the edge
    edge_label=g.es["label"],
    edge_label_color="red"
)
plt.show()
结果,我们得到
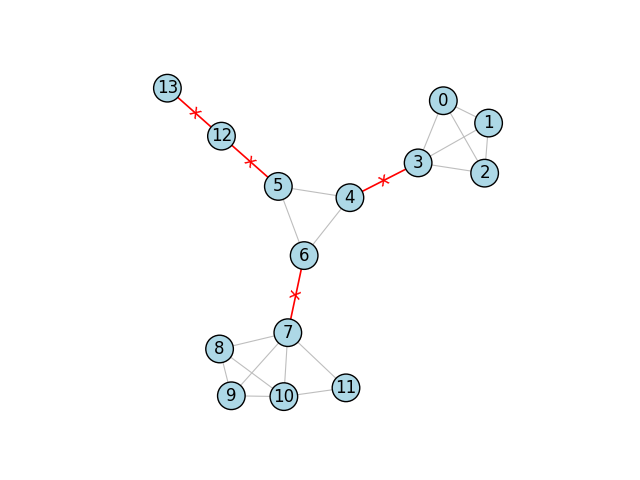
用附加的“x”效果标记的桥。