补图 
补图
此示例演示如何使用 complementer() 生成图的补图(有时称为反图)。
首先,我们生成一个随机图
import igraph as ig
import matplotlib.pyplot as plt
import random

# Create a random graph
random.seed(0)
g1 = ig.Graph.Erdos_Renyi(n=10, p=0.5)
要计算补图
# Generate complement
g2 = g1.complementer(loops=False)
当然,原始图及其补图的并集创建了完全图
g_full = g1 | g2
补图是具有相同数量的顶点且没有边的图
g_empty = g_full.complementer(loops=False)
为了理解这些结果,我们可以轻松地绘制这四个图
fig, axs = plt.subplots(2, 2)
ig.plot(
    g1,
    target=axs[0, 0],
    layout="circle",
    vertex_color="black",
)
axs[0, 0].set_title('Original graph')
ig.plot(
    g2,
    target=axs[0, 1],
    layout="circle",
    vertex_color="black",
)
axs[0, 1].set_title('Complement graph')

ig.plot(
    g_full,
    target=axs[1, 0],
    layout="circle",
    vertex_color="black",
)
axs[1, 0].set_title('Union graph')
ig.plot(
    g_empty,
    target=axs[1, 1],
    layout="circle",
    vertex_color="black",
)
axs[1, 1].set_title('Complement of union graph')
plt.show()
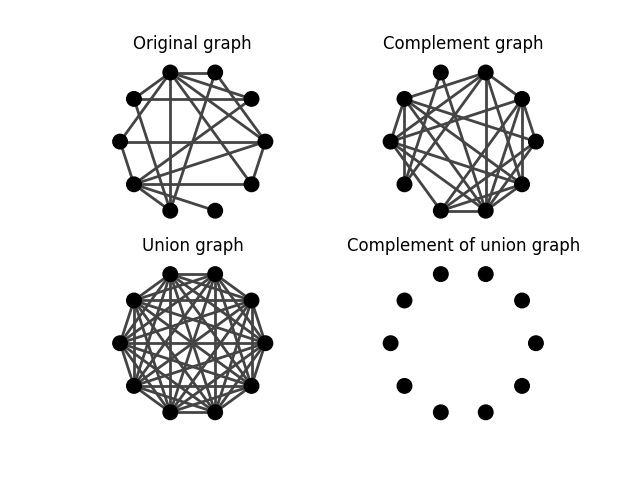
原始图(左上)、其补图(右上)、它们的并集(左下)及其补图(右下)。