配置实例 
配置实例
此示例展示了如何使用 igraph 的 配置实例来设置默认 igraph 设置。 这对于设置全局设置非常有用,这样就不需要在您处理的每个 igraph 项目的开头显式声明它们。
首先,我们定义默认的绘图后端、布局和调色板,并保存它们。 默认情况下,ig.config.save() 会将文件保存到 Linux 和 Max OS X 系统上的 ~/.igraphrc,或者 Windows 系统上的 C:\Documents and Settings\username\.igraphrc 中。
import igraph as ig

# Set configuration variables
ig.config["plotting.backend"] = "matplotlib"
ig.config["plotting.layout"] = "fruchterman_reingold"
ig.config["plotting.palette"] = "rainbow"

# Save configuration to ~/.igraphrc
ig.config.save()
此脚本只需要运行一次(将新的配置选项存储到 .igraphrc 文件中)。 无论何时使用 igraph 并且此文件存在,igraph 都会读取其内容并将这些选项用作默认值。 例如
import igraph as ig
import matplotlib.pyplot as plt
import random

# Generate a graph
random.seed(1)
g = ig.Graph.Barabasi(n=100, m=1)

# Calculate a color value between 0-200 for all nodes
betweenness = g.betweenness()
colors = [int(i * 200 / max(betweenness)) for i in betweenness]

# Plot the graph
ig.plot(g, vertex_color=colors, vertex_size=1, edge_width=0.3)
plt.show()
请注意,我们从未明确声明后端、布局或调色板,但最终图看起来像这样
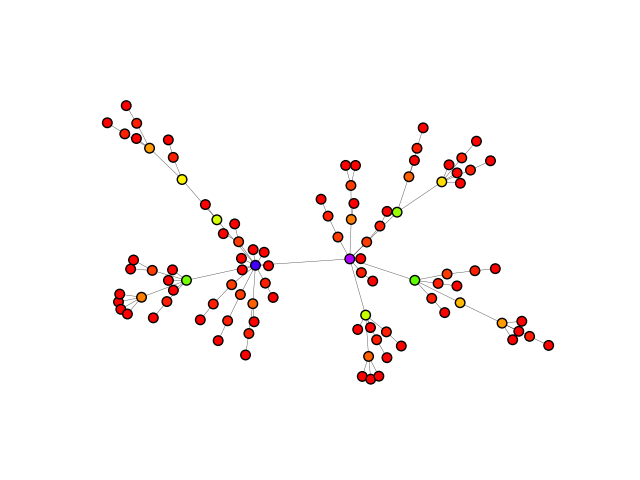
根据每个节点的介数中心性度量着色的图。
完整的配置设置列表可以在此处找到。
注意
您可以拥有多个配置文件:通过 ig.config.save("./path/to/config/file") 指定每个位置。 要加载特定的配置,请导入 igraph,然后调用 ig.config.load("./path/to/config/file")
注意
要在各个图之间使用一致的样式(例如,顶点大小、颜色、布局等),请查看 使用一致的样式绘制图。