连通分量 
连通分量
此示例演示如何使用 connected_components() 可视化图中的连通分量。
import igraph as ig
import matplotlib.pyplot as plt
import random

# Generate a random geometric graph with random vertex sizes
random.seed(0)
g = ig.Graph.GRG(50, 0.15)

# Cluster graph into weakly connected components
components = g.connected_components(mode='weak')

# Visualise different components
fig, ax = plt.subplots()
ig.plot(
    components,
    target=ax,
    palette=ig.RainbowPalette(),
    vertex_size=0.05,
    vertex_color=list(map(int, ig.rescale(components.membership, (0, 200), clamp=True))),
    edge_width=0.7
)

plt.show()
绘制结果如下
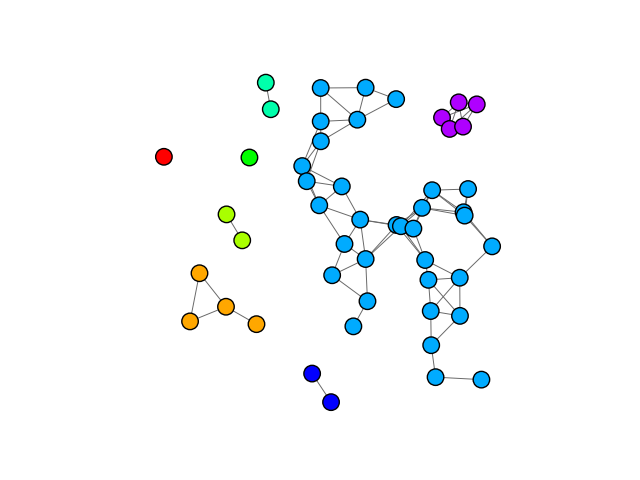
一个图被分离成它的弱连通分量。
注意
我们在顶点颜色中使用 0 到 200 的整数,而不是 0 到 255,因为在 彩虹调色板中,255 对应于循环回到红色。