生成树 
生成树
此示例演示如何使用 spanning_tree() 从输入图生成生成树。 对于查找最小生成树的相关概念,请参阅 最小生成树。
首先,我们创建一个 6x6 的网格图。
import igraph as ig
import matplotlib.pyplot as plt
import random

g = ig.Graph.Lattice([6, 6], circular=False)
作为可选步骤,我们使用 permute_vertices() 随机重新排列一些顶点 ID,以生成更有趣的生成树。
# Optional: Rearrange the vertex ids to get a more interesting spanning tree
layout = g.layout("grid")

random.seed(0)
permutation = list(range(g.vcount()))
random.shuffle(permutation)
g = g.permute_vertices(permutation)

# Calculate the new layout coordinates based on the permutation
new_layout = g.layout("grid")
for i in range(36):
    new_layout[permutation[i]] = layout[i]
layout = new_layout
最后,我们生成生成树并显示它。请注意,我们使用 None 作为权重值,以指示图中的任何生成树都可以。
# Generate spanning tree
spanning_tree = g.spanning_tree(weights=None, return_tree=False)

# Plot graph
g.es["color"] = "lightgray"
g.es[spanning_tree]["color"] = "midnightblue"
g.es["width"] = 0.5
g.es[spanning_tree]["width"] = 3.0

fig, ax = plt.subplots()
ig.plot(
    g,
    target=ax,
    layout=layout,
    vertex_color="lightblue",
    edge_width=g.es["width"]
)
plt.show()
最终图看起来像这样
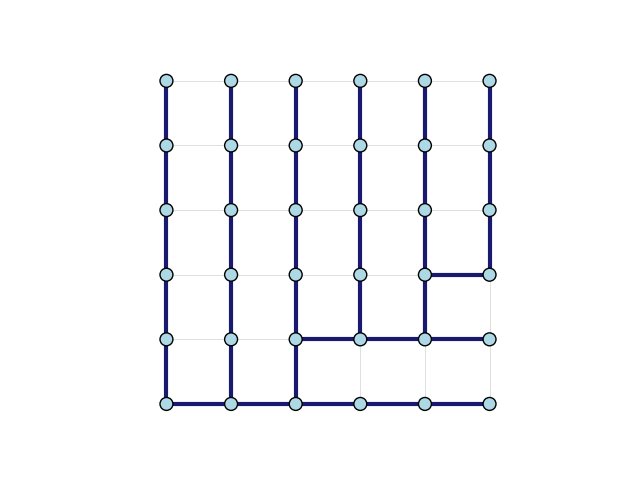
生成树的边已加粗。