团 (Cliques) 
团 (Cliques)
此示例展示了如何使用 cliques() 计算和可视化图的团。
import igraph as ig
import matplotlib.pyplot as plt

g = ig.Graph.Famous('Zachary')

# Compute cliques
cliques = g.cliques(4, 4)

# Plot each clique highlighted in a separate axes
fig, axs = plt.subplots(3, 4)
axs = axs.ravel()
for clique, ax in zip(cliques, axs):
    ig.plot(
        ig.VertexCover(g, [clique]),
        mark_groups=True, palette=ig.RainbowPalette(),
        edge_width=0.5,
        target=ax,
    )

plt.axis('off')
plt.show()
该图看起来像这样
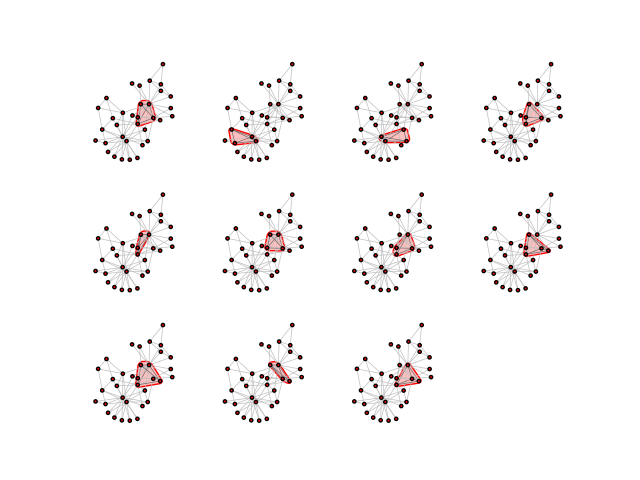
图的每个团在一个面板中突出显示
高级:改进绘图样式
如果你想要更多风格,你可以为每个团内的顶点/边着色,使其突出显示
import igraph as ig
import matplotlib.pyplot as plt

g = ig.Graph.Famous('Zachary')
cliques = g.cliques(4, 4)

fig, axs = plt.subplots(3, 4)
axs = axs.ravel()
for clique, ax in zip(cliques, axs):
    # Color vertices yellow/red based on whether they are in this clique
    g.vs['color'] = 'yellow'
    g.vs[clique]['color'] = 'red'

    # Color edges black/red based on whether they are in this clique
    clique_edges = g.es.select(_within=clique)
    g.es['color'] = 'black'
    clique_edges['color'] = 'red'
    # also increase thickness of clique edges
    g.es['width'] = 0.3
    clique_edges['width'] = 1

    ig.plot(
        ig.VertexCover(g, [clique]),
        mark_groups=True,
        palette=ig.RainbowPalette(),
        target=ax,
    )

plt.axis('off')
plt.show()
请看
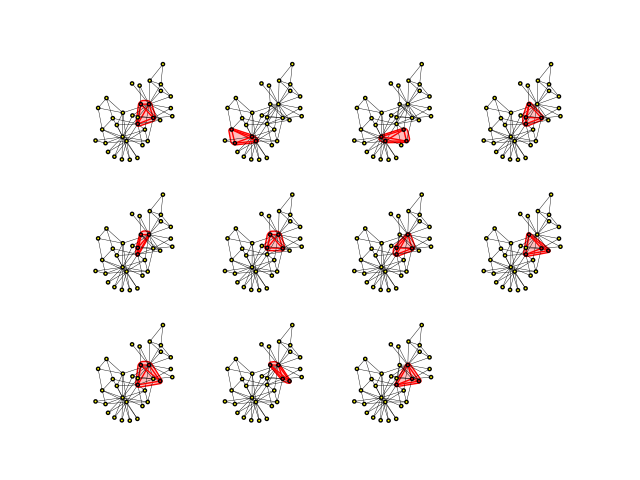
图的每个团在一个面板中突出显示,顶点和边也突出显示。