使用一致的样式绘制图形 
使用一致的样式绘制图形
此示例展示了如何使用字典解包,以便轻松地在多个图形中使用相同的视觉样式。这是一种快速简便的方法,可以在多个图形中快速共享单个视觉样式,而无需为绘制的每个图形反复复制和粘贴每个单独的属性。
import igraph as ig
import matplotlib.pyplot as plt
import math
import random

# Configure visual style
visual_style = {
    "edge_width": 0.3,
    "vertex_size": 1.5,
    "palette": "heat",
    "layout": "fruchterman_reingold"
}

# Generate four random graphs
random.seed(1)
gs = [ig.Graph.Barabasi(n=30, m=1) for i in range(4)]

# Calculate colors between 0-255 for all nodes
betweenness = [g.betweenness() for g in gs]
colors = [[int(i * 255 / max(btw)) for i in btw] for btw in betweenness]

# Plot the graphs, using the same predefined visual style for both
fig, axs = plt.subplots(2, 2)
axs = axs.ravel()
for g, color, ax in zip(gs, colors, axs):
    ig.plot(g, target=ax, vertex_color=color, **visual_style)
plt.show()
图表看起来像这样
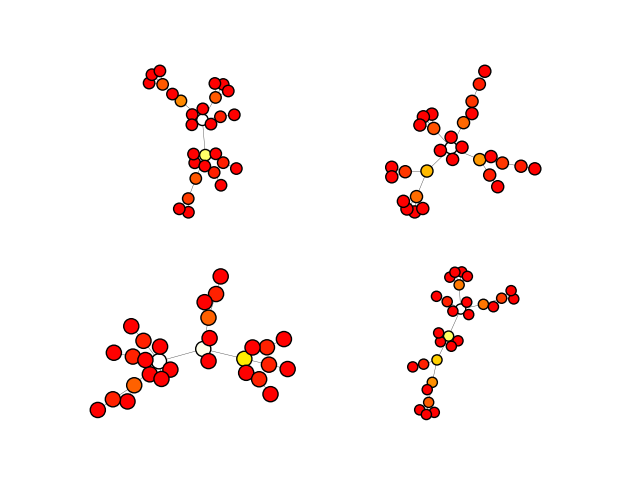
四个图形使用相同的调色板和布局算法。