割点 
割点
此示例演示了如何使用 articulation_points() 计算和可视化图中的割点。有关桥的示例,请参见桥。
import igraph as ig
import matplotlib.pyplot as plt

# Construct graph
g = ig.Graph.Formula(
    "0-1-2-0, 3:4:5:6 - 3:4:5:6, 2-3-7-8",
)


# Find the set of articulation points as a vertex sequence
articulation_points = g.vs[g.articulation_points()]

# Plot graph
fig, ax = plt.subplots()
ig.plot(
    g,
    target=ax,
    vertex_size=0.3,
    vertex_color="lightblue",
    vertex_label=range(g.vcount()),
    vertex_frame_color = ["red" if v in articulation_points else "black" for v in g.vs],
    vertex_frame_width = [3 if v in articulation_points else 1 for v in g.vs],
    edge_width=0.8,
    edge_color='gray'
)
plt.show()
该图看起来像这样
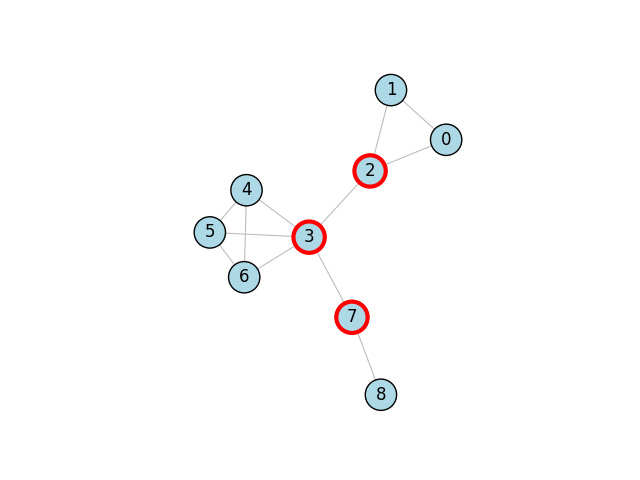
割点用红色边框标记。